Eve AI observability installation


Let AI instrument your LLM calls for you
Skip the manual setup — run this in your project and the wizard installs the SDK and wires up AI Observability for you.

Contents
- 1
Install dependencies
RequiredInstall PostHog AI, its OpenTelemetry peer dependencies, and Vercel's OpenTelemetry package.
Version note: This example uses
projectToken, which is available in@posthog/ai7.19.6 and later. Earlier 7.x versions useapiKey. - 2
Set environment variables
RequiredSet your PostHog project token and host in your Eve project's environment.
- 3
Add Eve instrumentation
RequiredCreate
agent/instrumentation.ts. Eve discovers this file and starts the exporter when your agent server starts. The optionaleventshandler uses Eve runtime context to identify spans with the user who started the session, falling back to the caller for the current turn.Note: To capture LLM events anonymously, omit the
eventshandler. See our docs on anonymous vs identified events to learn more.You can expect captured
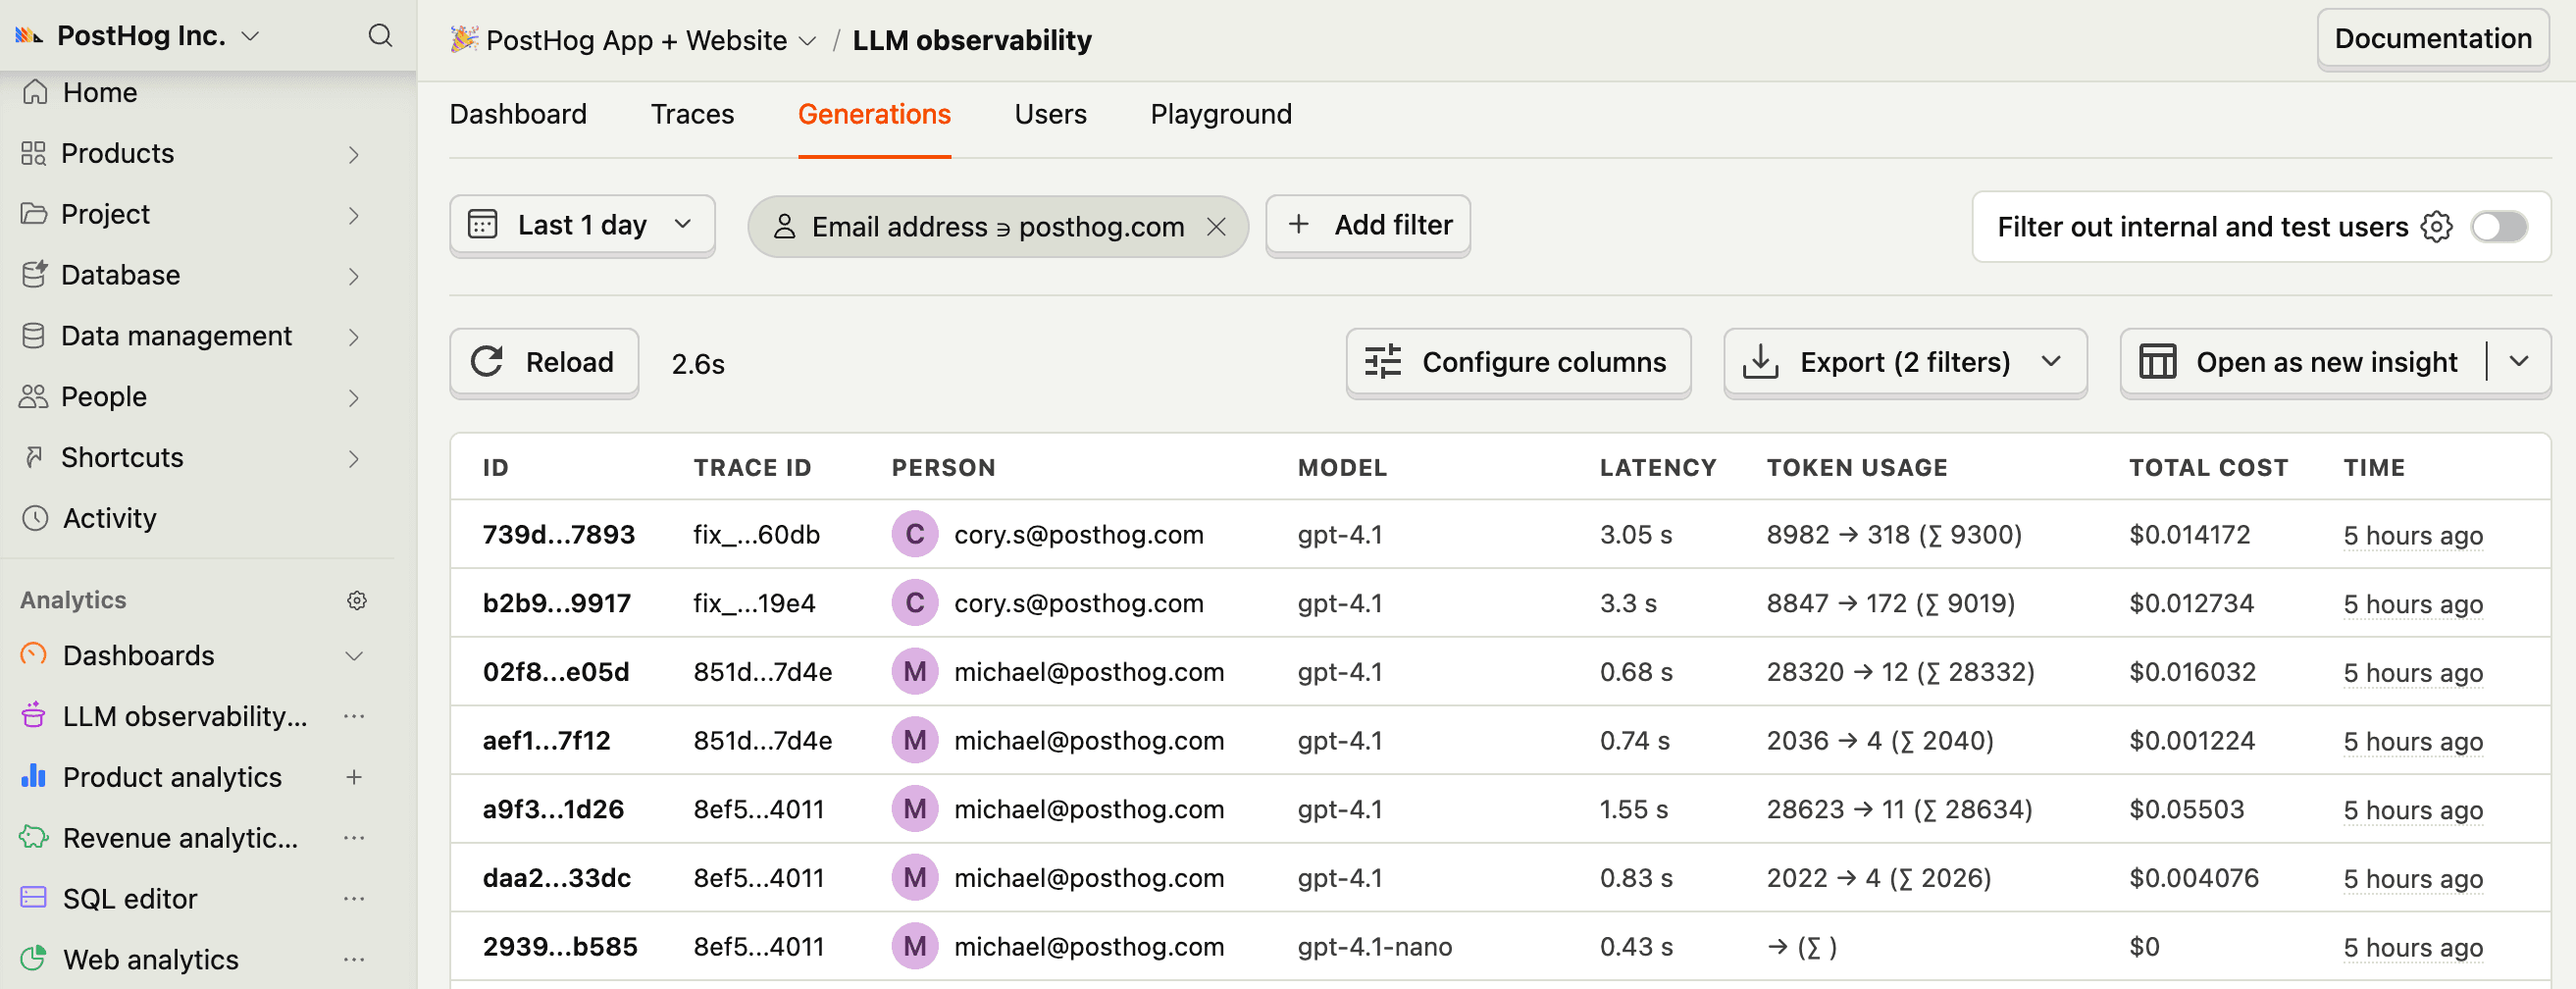
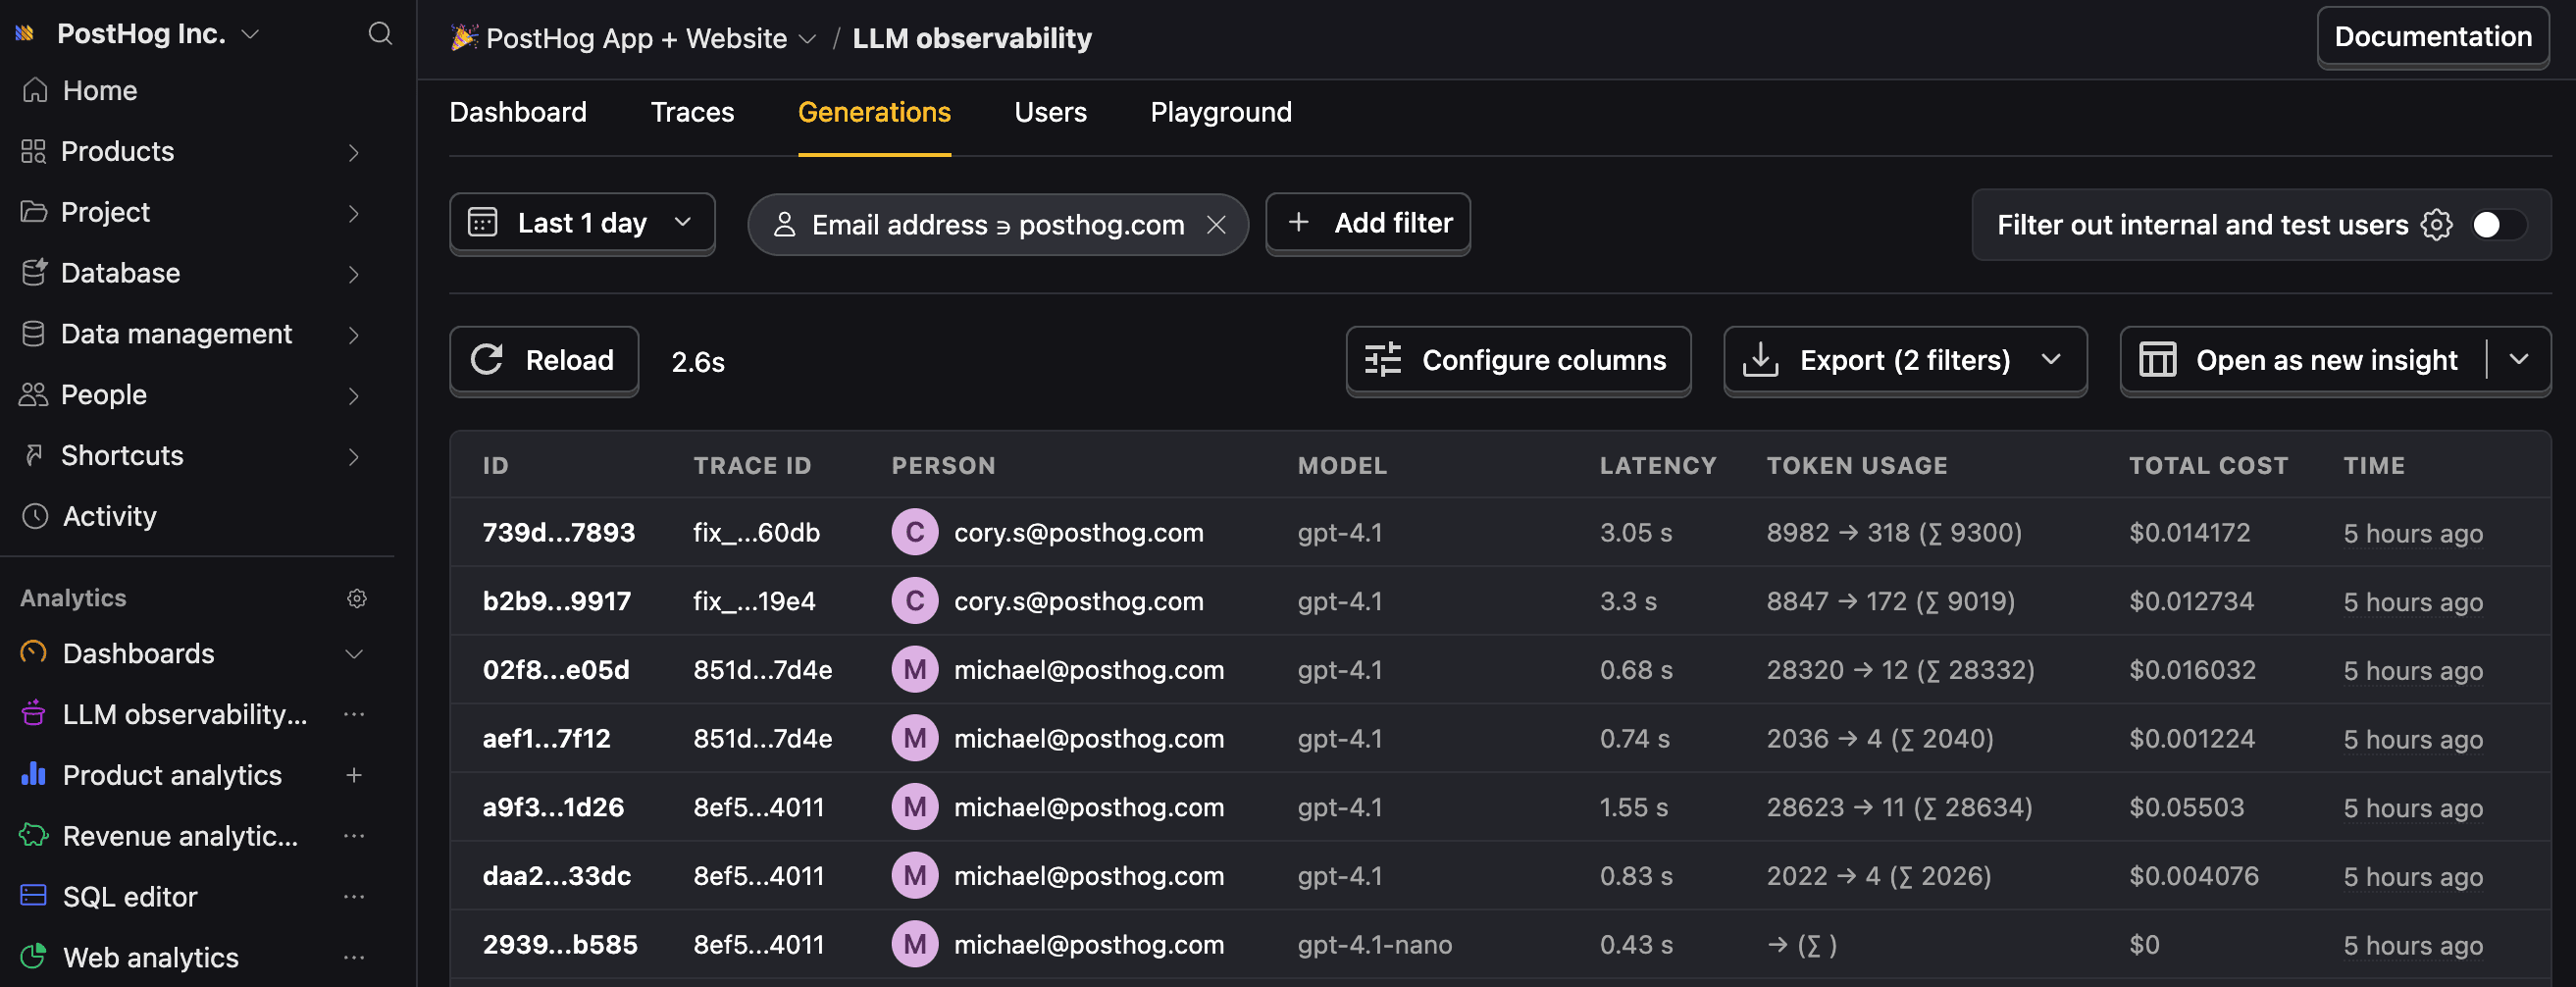
$ai_generationevents to have the following properties:Property Description $ai_modelThe specific model, like gpt-5-miniorclaude-4-sonnet$ai_latencyThe latency of the LLM call in seconds $ai_time_to_first_tokenTime to first token in seconds (streaming only) $ai_toolsTools and functions available to the LLM $ai_inputList of messages sent to the LLM $ai_input_tokensThe number of tokens in the input (often found in response.usage) $ai_output_choicesList of response choices from the LLM $ai_output_tokensThe number of tokens in the output (often found in response.usage)$ai_total_cost_usdThe total cost in USD (input + output) [...] See full list of properties - 4
Next steps
RecommendedNow that you're capturing AI conversations, continue with the resources below to learn what else AI Observability enables within the PostHog platform.
Resource Description Basics Learn the basics of how LLM calls become events in PostHog. Generations Read about the $ai_generationevent and its properties.Traces Explore the trace hierarchy and how to use it to debug LLM calls. Spans Review spans and their role in representing individual operations. Anaylze LLM performance Learn how to create dashboards to analyze LLM performance.